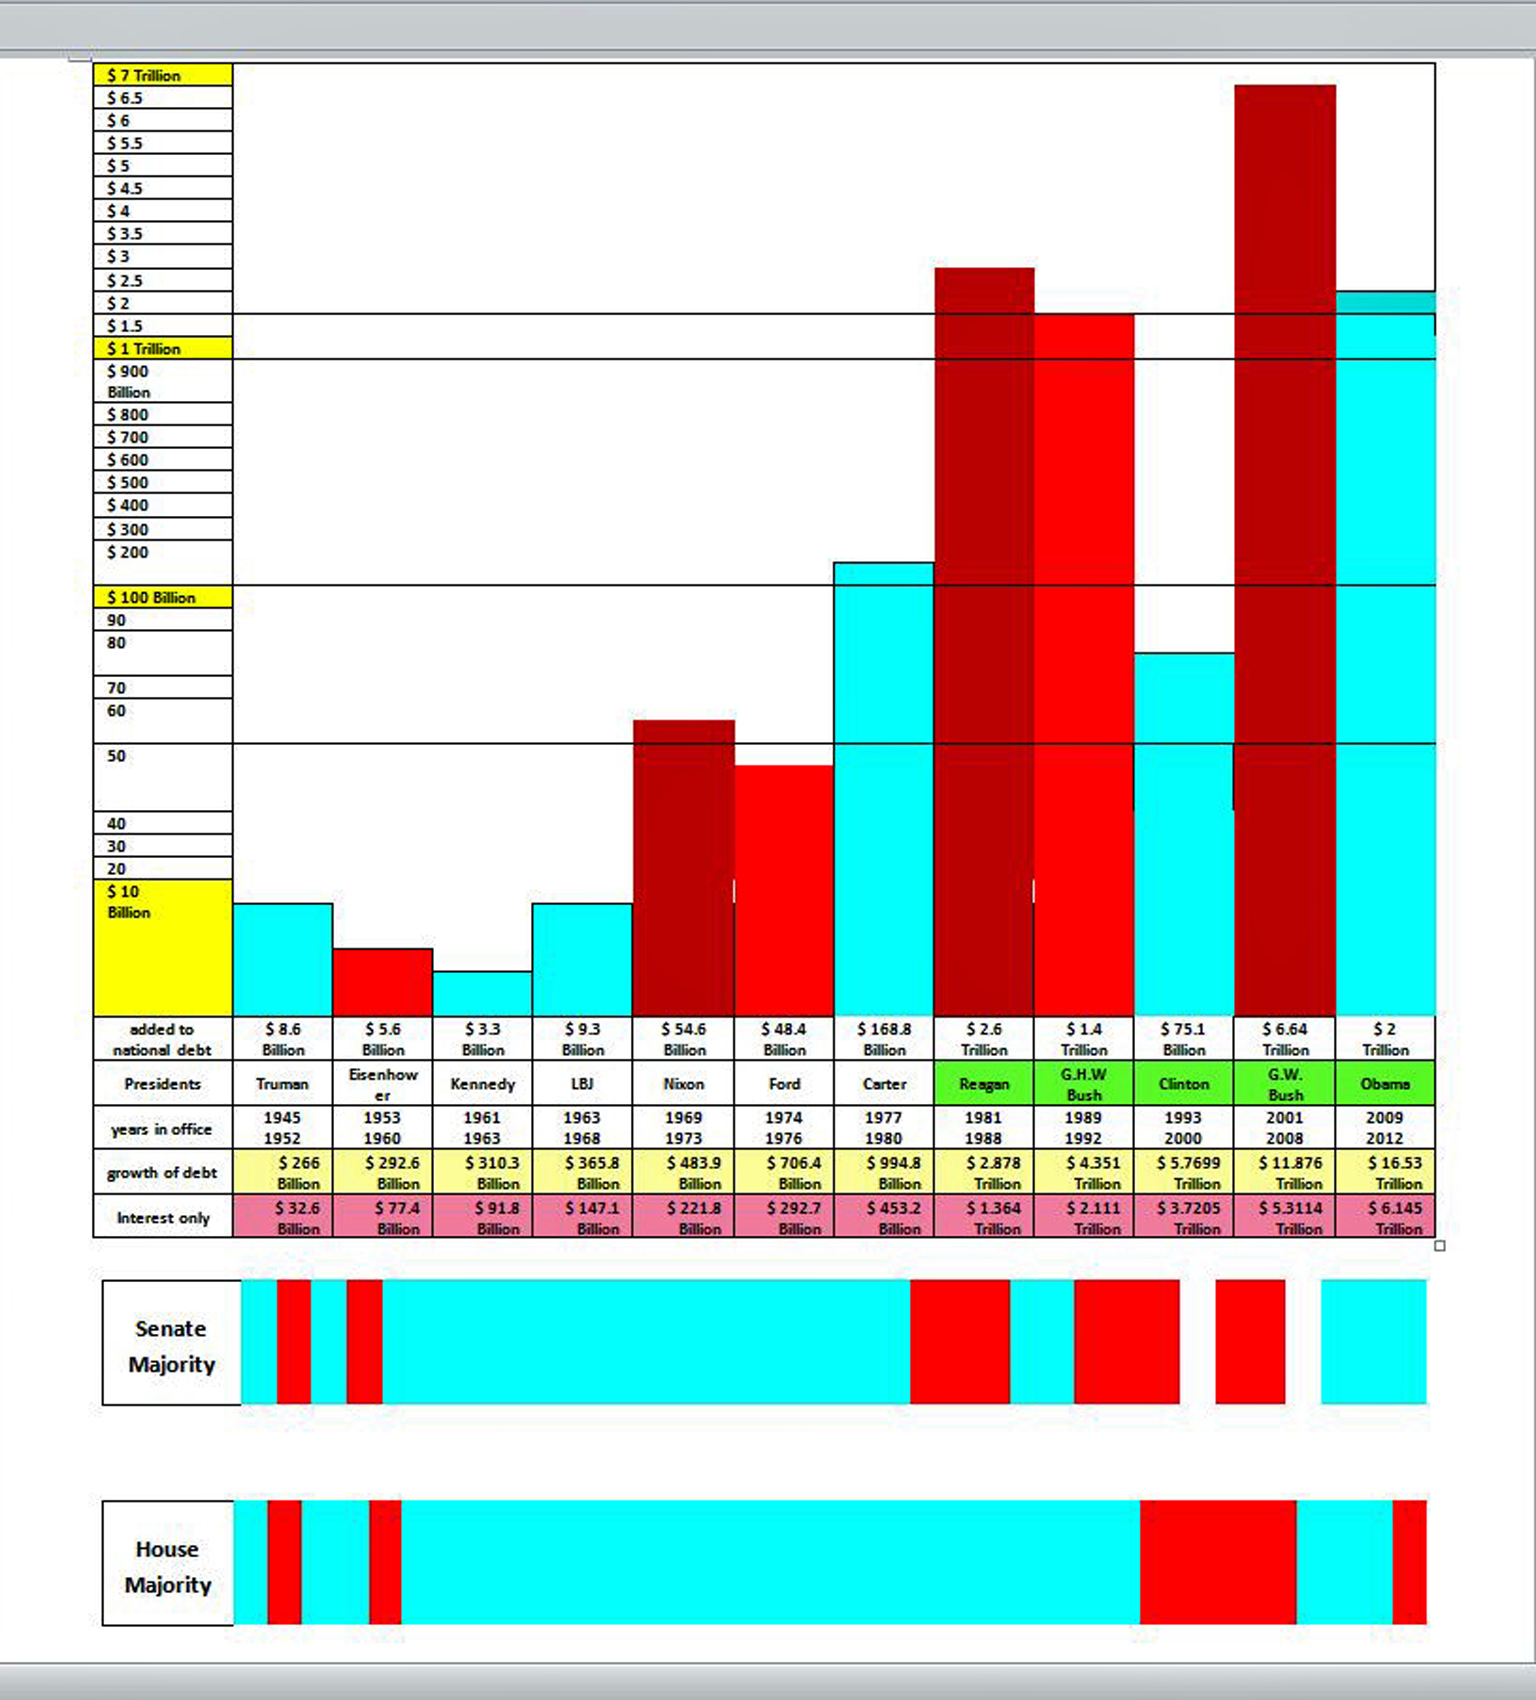
By president, starting with Truman in 1945, this info-graphic shows the growth of the national debt, the growth of the interest on the national debt, the lowest and highest tax rates at the beginning of each president’s term, the average GDP per president and the average unemployment rate during each president’s term.
In addition, at the bottom, the senate and house majorities are included for each president. Red is for the GOP (Republicans) and blue is for the Democrats. This way, anyone may see which party held the majority in one or both houses of Congress during periods where the debt increased the fastest. Starting with Reagan to Obama but not including Obama, the fastest gains were when a Republican was president and the GOP held a majority in one or both houses of Congress.
Using all of the data on this info-graphic, you may discover who holds the most responsibility by president and/or Congress for the growth of the national debt.
Starting with President Carter, pay attention to the growth of the debt in comparison to the changing tax rates and you may discover one of the reasons for the more than $16 Trillion national debt.
Also pay attention to the average unemployment rates of each president and you will learn that as the taxes went down, federal spending went up, and unemployment climbed (on average). Growth of annual GDP also started to drop as taxes dropped. From Truman – Ford, annual GDP averaged 3.85%, but from Carter to G. W. Bush, GDP averaged 2.96%.
Unemployment also went up as taxes went down. Truman to Ford, the average unemployment rate was 5.41% (and that includes the 8.09% under Ford).
From Carter to G. W. Bush, the average unemployment rate increased to 6.17%.
In fact, starting with Reagan, the total debt each president is responsible for includes the interest to December 2012.
– CLICK on INFO-GRAPHIC for LARGER IMAGE! –
* Reagan was responsible for lowering taxes from seventeen brackets to two brackets and those rates appear in G. H. W. Bush’s column
** The G. W. Bush tax cuts appear in President Obama’s column. However, in 2008, his last year in office, it was the worst year for jobs since 1945 and the unemployment rate was 7.2% in December. The total number of jobs lost in 2008 was 2.6 million. In addition, under-employment reached a record high from 715,000 to 8 million people, the highest since such records were first kept in 1955. Source: CNN.com
Then in 2008, G. W. Bush’s last year as president, the average GDP for the 4th quarter dropped to almost a minus10%. Source: Treasury.gov
*** Unemployment reached a high of 10% in October 2009 while GDP retreated to a minus 2.6%. The lowest unemployment rate reached 7.8% in September 2012 (Obama’s presidency does not end until 2016 so we do not have average unemployment for his term or a final average GDP). Source of data: bls.gov
Total GDP growth since 2009 to the first quarter in 2012 has been + 6.8%. Source: Treasury.gov
Data and facts mostly from primary sources:
Note: Deductions are not accounted for
- Tax Rate in 1945 under Truman (listed tax rates and brackets apply to all taxpayers with twenty-five tax brackets) – average unemployment during his term was 4.26% while GDP grew + 4.82%. Note: During the Great Depression, unemployment reached as high as almost 25%.
23% on earnings up to $2,000 but not over – adjusted for inflation $24,931
50% on earnings of $14,000 to $16,000 – adjusted for inflation $174,517 – 199,499
75% on earnings of $44,000 to $50,000 – adjusted for inflation $174,517 – 199,449
94% on earnings over $200,000 – adjusted for inflation $2,493,107
- Tax Rate in 1953 under Eisenhower (married filing separately with twenty-four/twenty-six tax brackets) – average unemployment was 4.89% during his term while GDP grew + 3%.
22.2% on earnings up to $2,000 but not over – adjusted for inflation $16,807
53% on earnings of $14,000 to $16,000 – adjusted for inflation $117,652 – 168,882
75% on earnings of $44,000 to $50,000 – adjusted for inflation $369,764 – 420,187
92% on earnings over $200,000 – adjusted for inflation $1,680,746
- Tax Rate in 1961 under Kennedy (married filing jointly with twenty-four/twenty-six tax brackets) – average unemployment was 5.97% during his term while GDP grew + 4.65%.
20% on earnings up to $4,000 but not over – adjusted for inflation $30,017
50% on earnings of $32,000 to $36,000 – adjusted for inflation $240,139 – 270,156
75% on earnings of $100,000 – 120,000- adjusted for inflation $750,434 – 900,520
91% on earnings over $400,000 – adjusted for inflation $3,001,734
- Tax Rate in 1963 under LBJ (married filing jointly with twenty-four/twenty-six tax brackets) –average unemployment was 4.17% during his term while GDP grew + 5.05%.
20% on earnings up to $4,000 but not over – adjusted for inflation $29,331
50% on earnings of $32,000 to $36,000 – adjusted for inflation $234,645 – 263,976
75% on earnings of $100,000 – 120,000- adjusted for inflation $733,267 – 879,920
91% on earnings over $400,000 – adjusted for inflation $2,933,067
- Tax Rate in 1969 under Nixon (married filing jointly with twenty-five/thirty-three tax brackets) – average unemployment was 5.09% during his term while GDP grew + 3%
14% on earnings up to $1,000 but not over – adjusted for inflation $6,114
36% on earnings of $24,000 to $28,000 – adjusted for inflation $164,733 – 171,644
53% on earnings of $52,000 – 64,000- adjusted for inflation $317,922 – 391,289
70% on earnings over $200,000 – adjusted for inflation $1,222,777
- Tax Rate in 1974 under Ford (married filing jointly with twenty-five/thirty-three tax brackets) – average unemployment was 8.09% during his term while GDP grew +2.6%.
14% on earnings up to $1,000 but not over – adjusted for inflation $4,551
36% on earnings of $24,000 to $28,000 – adjusted for inflation $109,231 – 127,437
53% on earnings of $52,000 – 64,000- adjusted for inflation $236,668 – 291,284
70% on earnings over $200,000 – adjusted for inflation $910,262
- Tax Rate in 1977 under Carter (married filing Jointly with twenty-six/thirty-four tax brackets) – average unemployment was 6.54% during his term while GDP grew +3.25%
0% on earnings up to $3,200 but not over – adjusted for inflation $11,848
36% on earnings of $27,200 to $31,200 – adjusted for inflation $100,712 – 115,522
53% on earnings of $55,200 – 67,200- adjusted for inflation $204,385 – 248,817
70% on earnings over $203,200 – adjusted for inflation $752,375
- Tax Rate in 1981 under Reagan (married filing jointly with sixteen/seventeen tax brackets) – average unemployment was 7.54% during his term while GDP grew 3.4%
0% on earnings up to $3,400 but not over – adjusted for inflation $8,393
37% on earnings of $29,200 to $35,200 – adjusted for inflation $73,806 – 86,888
54% on earnings of $60,000 – 85,600 – adjusted for inflation $148,105 – 211,297
70% on earnings over $215,400 – adjusted for inflation $531698
- Tax Rate in 1989 under G. H. W. Bush (married filing jointly with two tax brackets) – average unemployment was 6.3% during his term while GDP grew 2.17%
15% on earnings up to $30,950 but not over – adjusted for inflation $56,004
28% on earnings over $30,950 – adjusted for inflation $56,004
- Tax Rate in 1993 under Clinton (married filing jointly with five tax brackets) – average unemployment was 5.2% during his term while GDP grew 3.88%.
15% on earning up to $36,900 but not over – adjusted for inflation $57,298
39.6% on earnings over $250,000 – adjusted for inflation $388,200
- Tax Rate in 2001 under G. W. Bush (married filing jointly with five tax brackets) – average unemployment was 5.27% during his term while GDP grew 2.09%.
15% on earning up to $45,200 but not over – adjusted for inflation $57,267
39.1% on earnings over $297,350 – adjusted for inflation $376,725
- Tax Rate in 2009 under President Obama (married filing jointly with six tax brackets) – average unemployment reached a high of 10% in October 2009 while GDP shrunk a minus – 2.6%. The lowest unemployment reached 7.8% in September 2012 (Obama’s presidency does not end until 2016 so we do not have average unemployment or GDP for his term). Source: bls.gov
10% on earnings up to by not over $16,700 – adjusted for inflation $17,466
25% on earnings of $67,900 – 137,050 – adjusted for inflation $71,015 – $143,338
35% on earnings over $372,950 -adjusted for inflation $390,060
____________________________
According to Dave Manuel.com, “From 1948 through to 2009, the United States economy has grown by an average of 3.28% per year. … If we exclude Barack Obama due to incomplete data, then the worst performance was turned in by George W. Bush, as the economy grew by an average of 2.09% per year during his time as president.”
“Democrats have occupied the White House in 26 of the 62 years since 1948. Average GDP growth in the country over those 26 years has been 4.01%.
“Republicans have occupied the White House in 36 of the 62 years since 1948. Average GDP growth over those 36 years has been 2.75%.”
Do you know the difference between a primary fact gathering source, the media and an opinionated radio or TV talk show or Blog?
Answer: primary fact gathering sources are where the media, talk shows and Blogs get their facts. A few examples of primary fact gathering sources are the US Treasury, the Bureau of Labor Statists, the Centers for Disease Control, the FBI, the CIA Factbook and the World Bank.
However, then what the public hears may be distorted due to political and/or religious bias or political agenda.
The US Treasury reports that, “From 2009 to the present, federal revenues relative to the economy have been at their lowest levels in 60 years.
However, “Growth in the U.S. has outpaced that of other advanced economies (Germany, Euro area, Japan and UK) affected by the global financial crisis.
“Total GDP growth since 2009 to the first quarter in 2012 was + 6.8%.” But in the fourth quarter of 2008, G. W. Bush’s last year as president, average GDP was almost a minus10%.
Then by the 3rd quarter of 2009, GDP had returned to growth instead of loss and has stayed in the growth area since then. Source: Treasury.gov
Other sources used for this post:
Discover more from The Evolution of a National Burden
______________
Lloyd Lofthouse is the award-winning author of The Concubine Saga.
To follow this Blog via E-mail see upper left-hand column and click on “Follow”

Comments are welcome — pro or con. However, comments must focus on the topic of the post, be civil and avoid ad hominem attacks.